About this project
For the telecom company Tele2, I redesigned the data advice tool. The objective of this tool is to tell someone how much data he/she uses every month. Based on that monthly data usage, the user can buy the right data bundle.
Wireframing
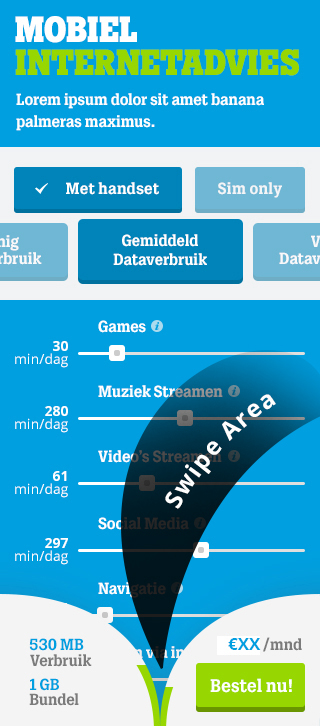
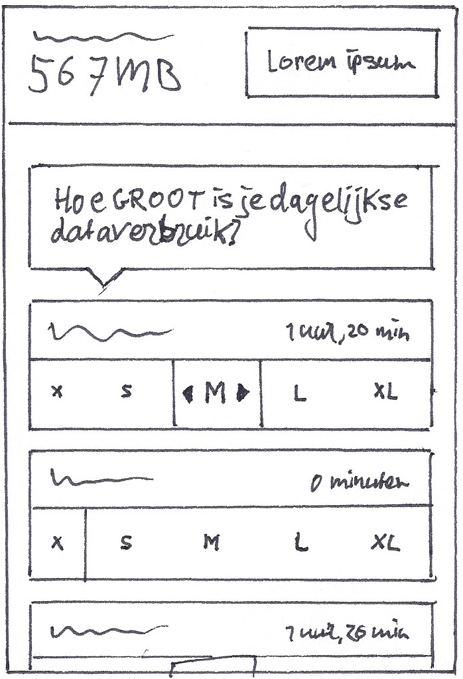
The main interaction in this tool is the slider. The user can define how many data he/she is using every day for each category (social media, streaming videos, etc). I’ve experimented with the regular sliders (the once you’ll see in the designs below), but not everyone knows their exact data usage. For many people, it would be easy to select “small” or “large” for instance, which is impossible with a regular slider. Or is it? Because I still like the control of a slider, I decided to combine the categories with the slider element.
Design iterations
Wireframing and designing have more in common than most people think.
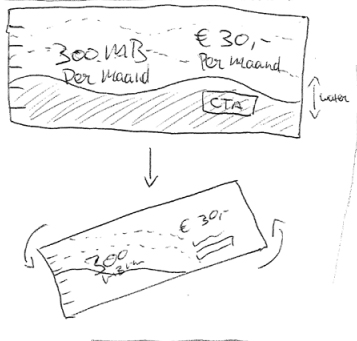
During this project, I jumped back and forth between wireframing and designing. I wanted to see how my wireframes look on the screen. By regularly converting wireframes to a (low fidelity) design, I can anticipate structures to the visual design.
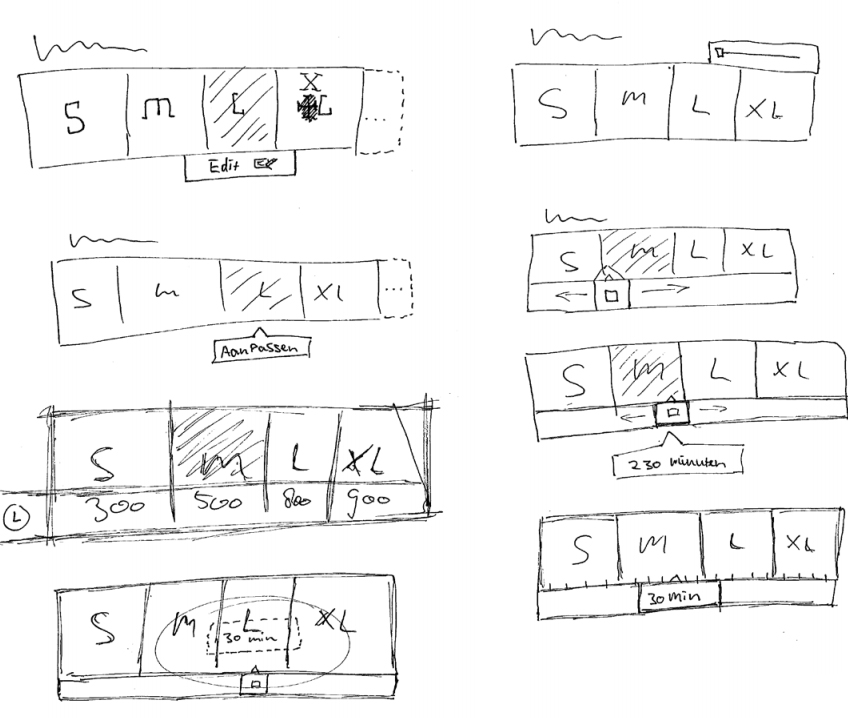
So I sketched quick ideas on paper and I worked the best ones out in Photoshop to see what needs structural and spacial improvements.
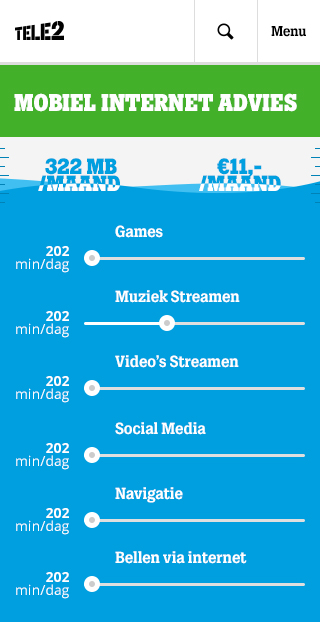
Every slider had a tooltip that can be pushed for more information. I quickly worked it out in a motion design to ask the developers if it was possible to make this. It was possible, but very time consuming.
After iterating the design of the sliders, I decided to drop the tooltip, because the new slider was more natural to use. I tested the sliders with a paper prototype and think aloud and I discovered that people didn’t need additional information anymore.
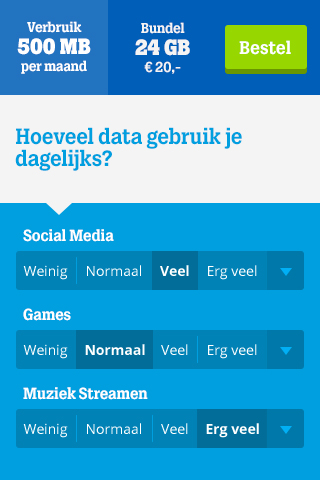

After designing the tool with regular sliders, I wanted to see how I could implement category selectors (if that’s a word). The users can select how many data they are using per category. The arrow in the sliders of the left design and the dots in the slider of the right design can be pressed to reveal a slider, because some users want more control over the input.
My next thought: can a slider and a button be combined? Spoiler alert: yes!
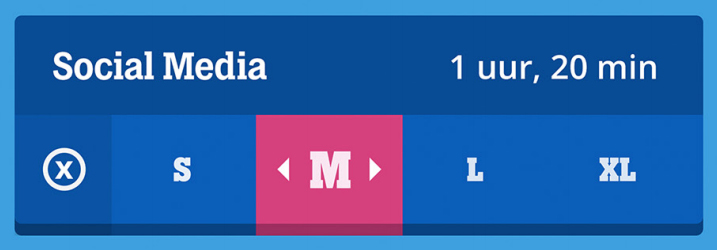
This is the world’s first category slider!
If the question is: “How long are you on social media every day?” And the user selects “Medium”, the user will see that medium social media usage a day is 1 hour and 20 minutes. But if the user wants to add more minutes to that, he/she can just slide the category “Medium” to the right. When he slides it too far to the right, the category changes into Large.
Want to see it in action? Lets scroll down!
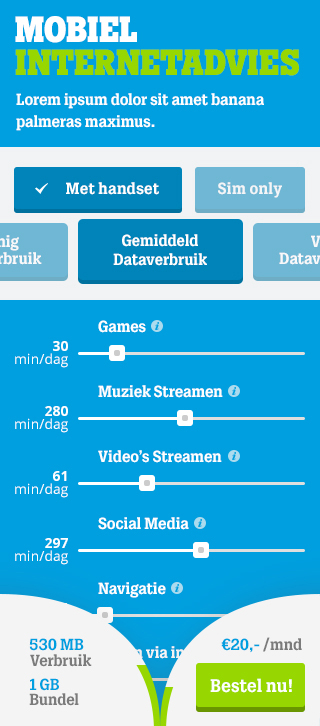
The end result


To make the tool more fun for people, I added transitions to the design. And I worked out the category slider design, so the developers know how it works.


